POST
Starting data2viz.io
As a first entry in this blog, we are going to explain the foundations of the data2viz project, its motivations and our vision of its future.
No good dataviz tool in the JVM
The first idea of this project happened as I was looking in the machine learning area.
I had previously taken the course https://en.coursera.org/learn/machine-learning where
all exercises were done using the mathematical tool Octave.
I wanted to do them all again but this time using
frameworks that could be used in production. I was planning to use Spark MLib and looked for a
tool to help me visualize my algorithms. I had the surprise to discover that, in the jvm
ecosystem, there were no good data visualization tools.
That was the start of the inception.
- There should be a good dataviz tool in t he JVM.
- It should allows to have a lot of features: geographic maps, animations, user interactions, …
- APIs should be explicit and easy to use.
D3.js as an inspiration
Javascript ecosystem has an amazing visualization library: D3.js. It is very popular (70k stars on github). A lot of tools are based on it (nvd3, HighCharts, RAWGraphs).

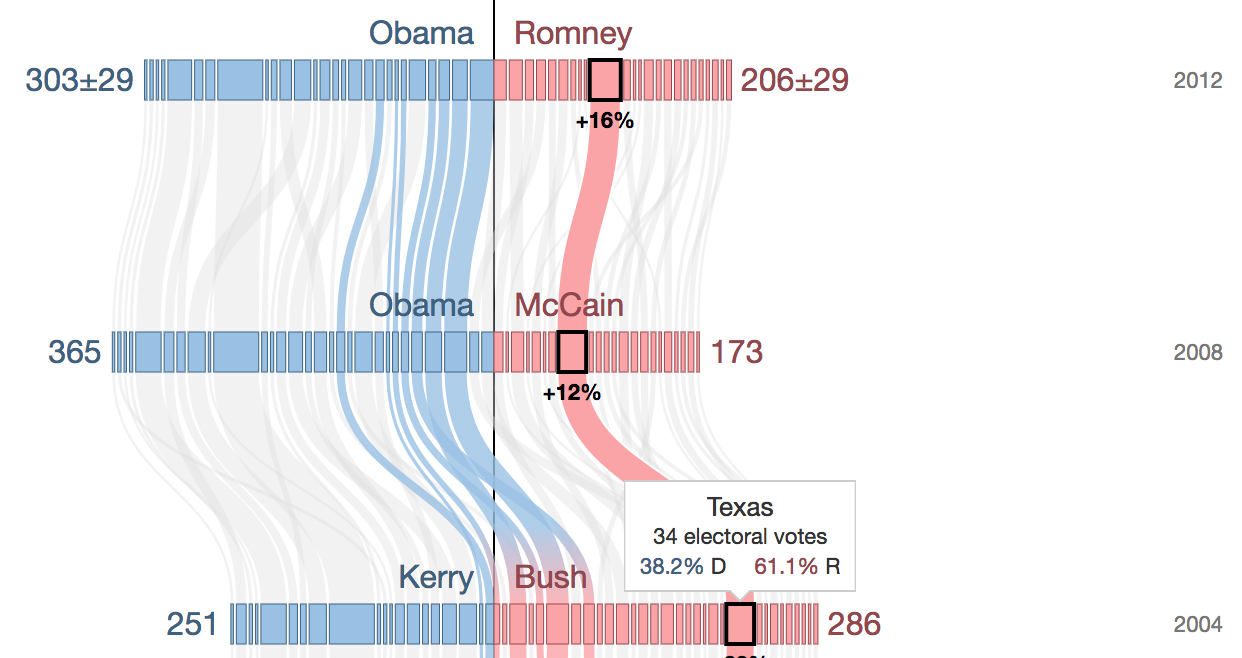
A example of D3js visualization
Its creator Mike Bostock has been working on it and its previous form (protovis) since 2009. It’s performant, lot of concepts have already been tested in plenty of contexts and use cases. It’s clearly one of the best source of inspiration.
We rapidly decided to create an open-source library from the concepts of D3.js.
We know that D3 has some weaknesses. The syntax is not always very understandable.
Take this code:
d3.select("body")
  .append("svg")
    .attr("width", 960)
    .attr("height", 500)
  .append("g")
    .attr("transform", "translate(20,20)")
  .append("rect")
    .attr("width", 920)
    .attr("height", 460);
The use of one statement with chained function calls makes it difficult to understand.
Is g a child of svg, rect a child of g or are their all at the same depth?
The open source project
Being a big fan of kotlin for a long time (I deployed server side applications implemented in kotlin since 2014), I knew its potential for this project.
First, the language allows to create strong internal DSLs.
val rotation = 45.deg

svg {
    width = 500
    height = 500
    group {
        transform (rotate = rotation)
        rectangle {
            cx = 100.0
            cy = 100.0
            radius = 20.0
        }
    }
}
In that example, 45.deg is an extension on integer that adds a property deg which is an instance of Angle.
We are using strong type objects. An Angle is not just a number. It’s really an Angle that can be
described using few units (degrees, rad, grad). A rotation is defined by an Angle. When the developer
writes his code, the IDE is checking immediately that correct parameter types are used for every call. It’s
a great assistance that allows to be much more productive than with a dynamic language.
Another great asset of kotlin is its multiplatform deployment.
With kotlin, it is possible to compile code to both JVM and JS (kotlin is JS production ready since version 1.1).

Deploying dataviz code
So the main idea was to start from d3js concepts and algorithms, port them into an open source kotlin library. We started this part of the project in Q2 2017. Taking D3.js as an example, we’ve been essentialy focused on the kotlin.js implementation but the idea is to have a truly multiplatform version.
What’s next?
Coding an open source library is not an end in itself. At one moment you need to earn some money for a living.
We are also working on tooling this library. Indeed, the code assistance provided by an IDE is a first step for productive building of datavisualizations but we can go much further.
The process of building dataviz is based on the transformation of domain objects (data) into visual concept (shapes, colors, animation, …).
All these are transformation functions that could be configurate with the assistance of editors.
The chrome dev plugin has this kind of editor:

Having a bunch of transformation functions and associated editors would make the creation of dataviz really more productive.
That is our long term vision for data2viz!