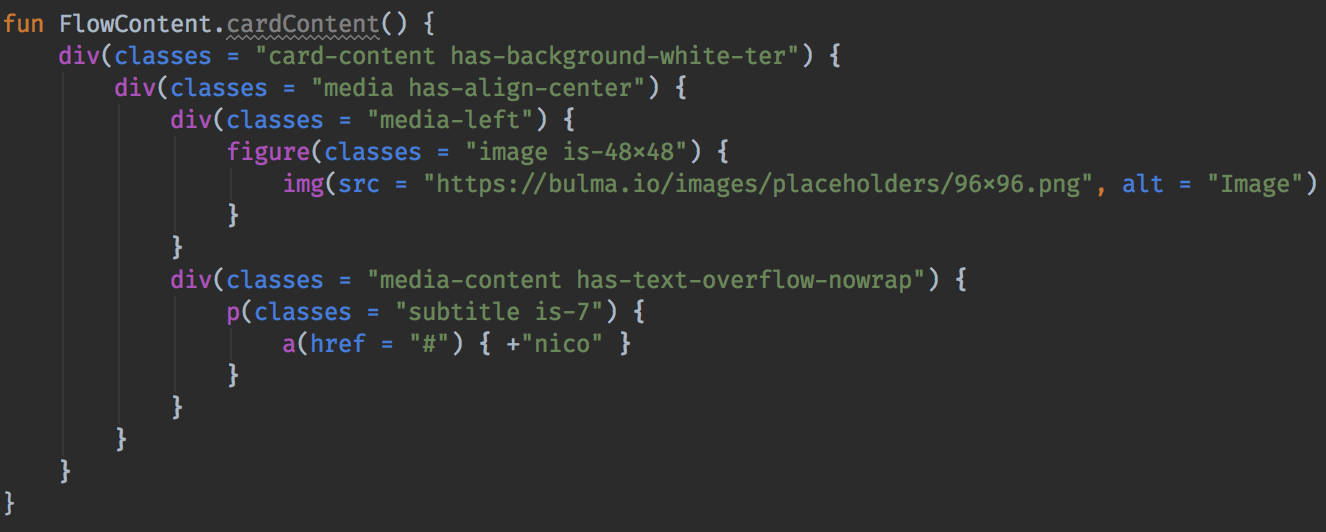
We love Kotlin, we love DSLs, and when we have to develop a web application, we naturally want to use Kotlinx.html. It proposes a nice DSL to generate HTML fragments on the server using Kotlin/JVM or the browser with Kotlin/JS.
Dot plots are usually recommended for small sets of data, as bar charts are preferred when we need to represent
larger sets. However, an interactive chart allows you to manage both “uniqueness” and “volume” of your data set.